


What Percentage of Companies In EU Allow Employees In Their Decision-making Process? Check Full Details Here

Approximately 31% of companies in the European Union (EU27) facilitated the regular direct participation of employees in organisational decision-making process.

According to European Company Survey 2019, approximately one-third (31%) of companies in the European Union (EU27) facilitated the regular direct participation of employees in organisational decision-making process.
The Survey found that more than half of establishments in Sweden (56%) and Denmark (55%) were considered by regular, high influence direct engagement with employees, nonetheless only around a 5th in Poland (20%) and the Netherlands (21%).
These figures are based on the findings in the 4thEuropean Company Survey, conducted in partnership between EU Agencies Eurofound and Cedefop.
It provides information on workplace practices, human resource Management, skills and development, employee participation and social dialogue from 21,869 Human Resources managers and 3,073 employee representatives in the 27 EU Member States and the United Kingdom during 2019.
Popular Tools for employee participation and their usage.
The report says that establishments use various means to engage with employees, and these vary in the degree to which they are top-down or bottom-up as well as the degree of interaction involved.
However, the ECS 2019 discovered four popular tools where most of the companies use as a method of interaction with employees. The following figure shows the four major tools and their level of influence.
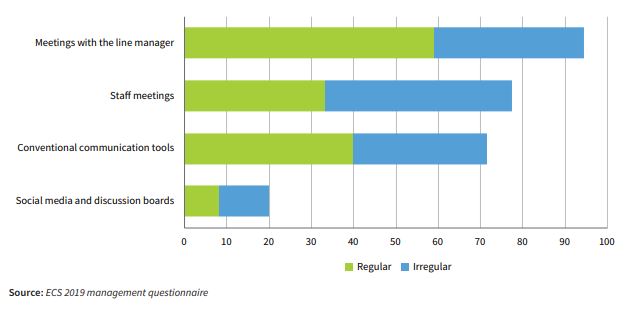
The study discovered that majority of companies (94% in the EU27) that encouraged employee participation in organizational decision-making process organize regular meetings between employees and their line manager as a method to engage with employees.
The analysis says that regular meetings between employees and their immediate manager are most prevalent in Sweden (82%) and Austria (76%) and least prevalent in Poland (42%) and Croatia (43%).
In terms of Sector, such meetings are most prevalent in other services (69%) and least prevalent in transport (46%).
The survey results show that large establishments are more likely to hold regular meetings between employees and their immediate manager (66%) than medium-sized (62%) and small (58%) establishments.


 facilitated the regular direct participation of employees in organisational decision-making process.")